
In Part 2 of this series we explored the first 3 training cycles, or 9 weeks, of the 2017-18 season and gave context around the Load-Velocity Profiles provided by 1080 Sprint.
In this installment we will dive further into the training season, comparing and contrasting Athletes 2 and 3 (Table 1) from the last article.

The period we will look at spans weeks 13-18 (Cycles 5 and 6) of the training year, or a time period of January 1st – February 11th, 2018. Throughout this 6-week timeframe each athlete competed at two indoor track meets (Jan. 19-20th and Feb. 3rd-4th) in the 60m dash.
Athlete 2 completed 6 resisted acceleration sessions with the 1080 Sprint while Athlete 3 completed five such sessions. The breakdown of repetitions completed at various percentage bodyweight (BW) can be seen in Fig. 1 below.
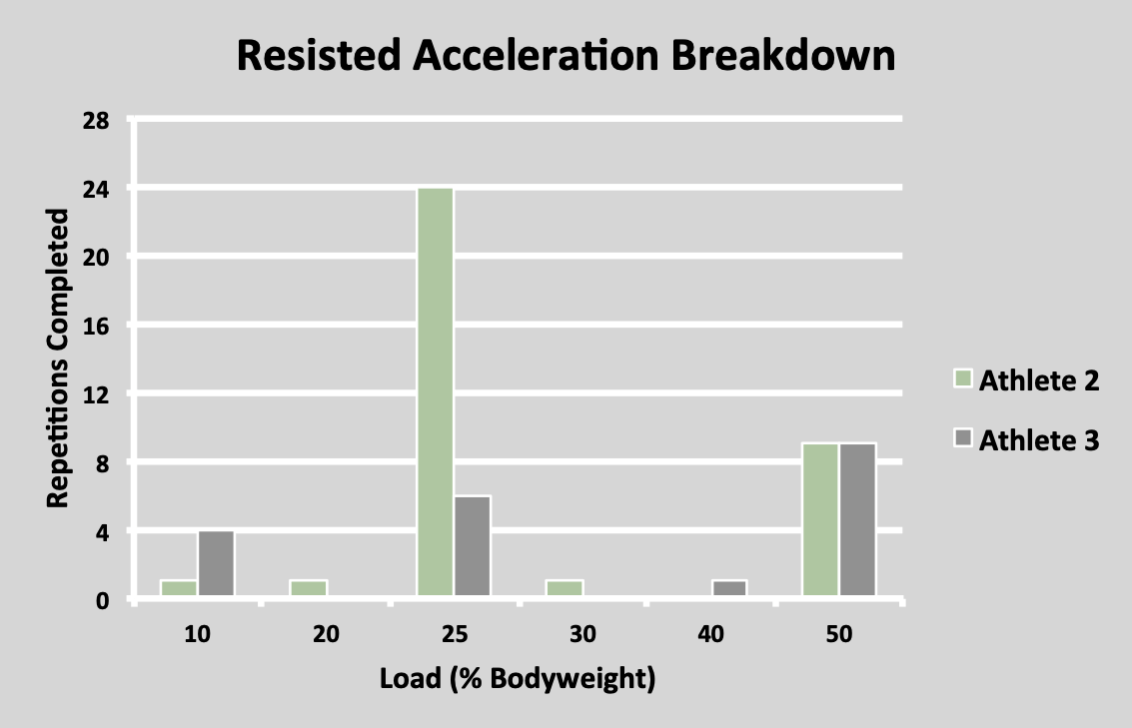
Athlete 2 performed 35 total resisted accelerations during this time period, with 69% of these repetitions at 25% bodyweight.
Athlete 3 performed 20 total resisted accelerations during this time period with 45% of these at 50% bodyweight, and 30% of the repetitions at 25% bodyweight.
In addition to these resisted repetitions, each athlete performed one repetition with a resisted load of 1kg at the start of each session. This is the lightest possible load that will allow for data collection with the 1080 Sprint and the athlete group reported no perception of resistance.
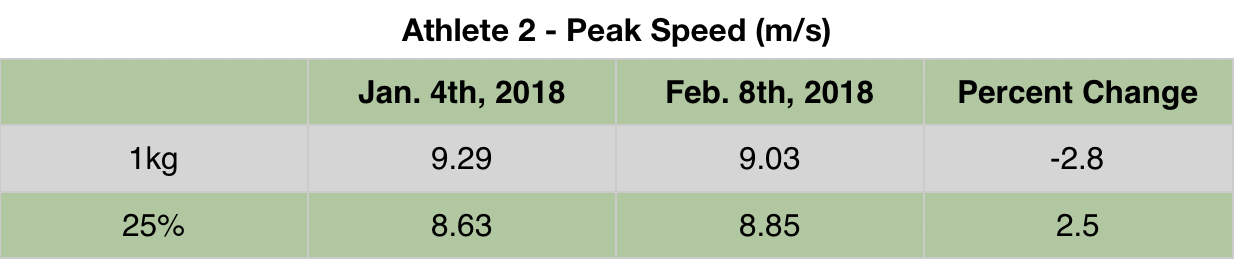
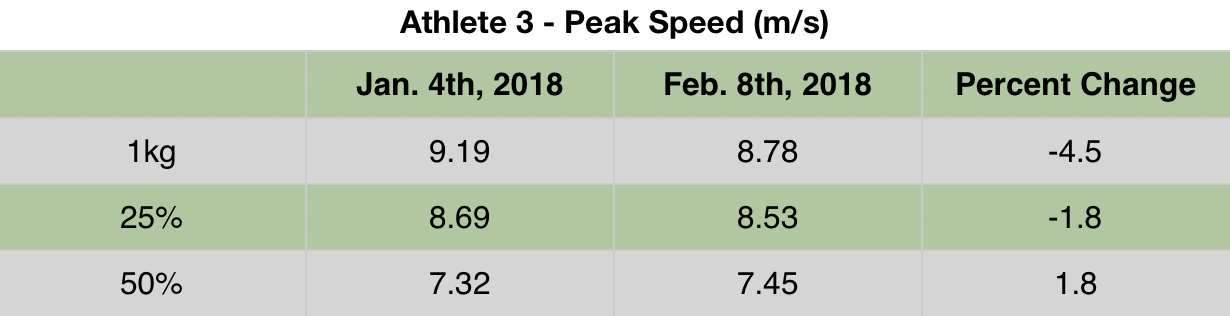
Therefore, the data we will look at within this timeframe comes from loads of 1kg and 25%BW for both athletes as well as the 50%BW loads for athlete 3.
Beginning with Athlete 2, we see a decrease in peak speed at the 1kg load from 9.29 meters/second (m/s) to 9.03 m/s and an increase in peak speed at the 25%BW load from 8.63 to 8.85 m/s.
Athlete 3 saw decreases from 9.19 to 8.78 m/s and from 8.69 to 8.53 m/s for the 1kg and 25%BW loads respectively. With the 50%BW load, Athlete 3 saw an improvement in peak speed from 7.32 to 7.45 m/s during this time frame. The first repetition of the season this athlete performed at a load of 50%BW occurred on November 23rd with a peak speed achieved of 7.00 m/s. This equates to a percent increase of 6.4%.
The Context Principle
In his book, The End of Average, Todd Rose discusses three principles of individuality – jaggedness, context, and pathways.
The Jaggedness Principle tells us that our abilities cannot be described by a single-dimension score, such as that on a standardized test.
The Pathways Principle tells us that there are many, equally valid ways to reach the same outcome as opposed to a predetermined blueprint based on biology.
Finally, the Context Principle tells us that behavior is not determined by traits or the situation, but a unique interaction between the two.
With this, it is important to provide some more context around this data.
A few reasons exist that may help explain these results. First, in regards to the 1kg loads, these repetitions came first in the session and seemed to contain the most variability in athlete readiness (although they did all follow a standardized warm-up) and intent.
Additionally, the session on February 8th came following an indoor competition in New Mexico for each athlete where they both ran season’s best performances in the 60m dash. The fatigue from travel and competition must be considered when analyzing these numbers. Relating to this, the first session within this timeframe came following a week of active recovery throughout the holiday season.
Lastly, the increase in performance with 25%BW for Athlete 2 and with 50%BW with Athlete 3 may simply be representative of the SAID Principle in that each athlete performed the majority of their repetitions at those loads within this timeframe.
Limitations
The inconsistency in effort exhibited within the resisted sprint sessions remains from the previous timeframes examined. These variations are due to numerous factors including motivation, health, training load priorities, and more.
An additional limitation present with this timeframe of analysis is variability in footwear. Some sessions were completed wearing training shoes and some with track spikes. These differences were based on the desired intensity for each session and will be tracked in the future.
Moving Forward
The utilization of resisted sprinting sessions became sporadic following the timeframe examined. A shift in Key Performance Indicators accompanied the varied competition and travel schedules.
As we begin the 2018-19 training season we will continue our attempt to minimize the limitations, fine-tune the training prescription, and organize the data collection and analysis more efficiently.
One focal point within this will be finding anchors to provide more context to the data. Conversations with Dr. Matt Jordan highlighted the importance of these anchors (training load, readiness, wellness, etc.) and their importance was certainly made clear throughout this initial foray into data collection with the 1080 Sprint.
Stay tuned for more!
Interesting Aside
The effect of heavy resisted accelerations on sprint mechanics was discussed in Part I of this series. To further that discussion we can explore the following kinogram. Through a standardized filming process we can use such kinograms to identify asymmetries and abnormal mechanics, track impact of intervention, understand individual solutions, and more.
Through this kinogram we can see the ability of this athlete to reach very similar positions throughout his stride despite the varying loads.
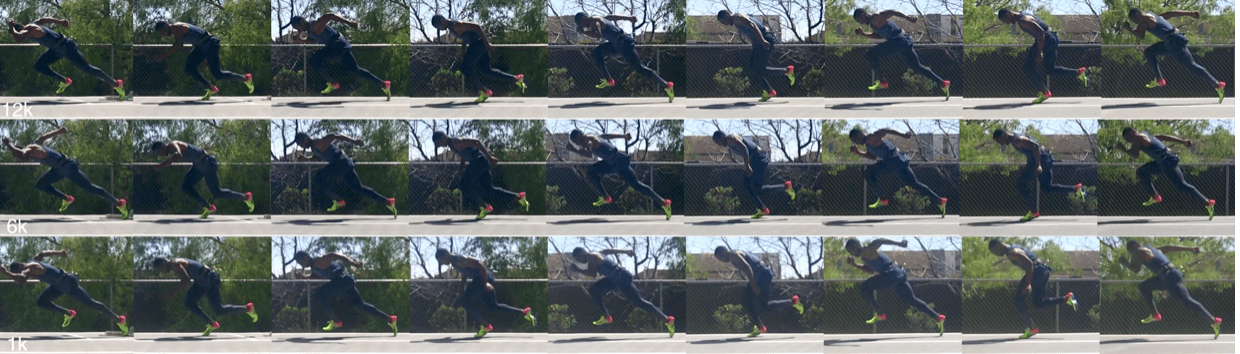
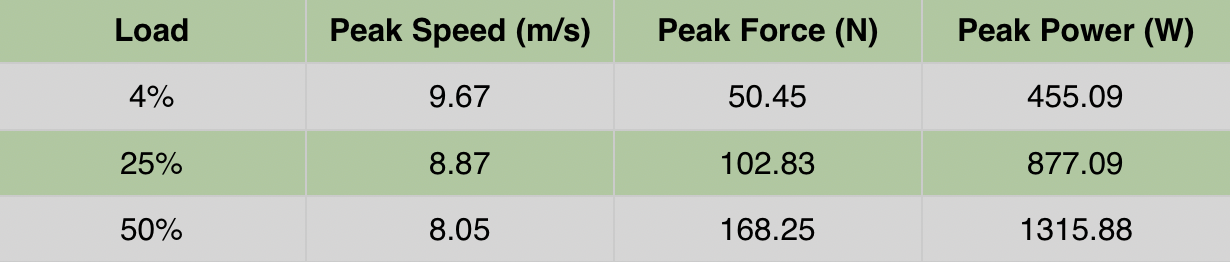
From bottom to top the images highlight repetitions performed at loads of 1kg, 6kg, and 12kg. These loads were approximately 4%, 25%, and 50% bodyweight when converted to a plate-loaded sled on turf for the pictured athlete. Data collected from the 1080 Sprint for this athlete at these loads can be seen in Table 4 below.
While this is undoubtedly a small sample size, it is representative of the performances we saw with each athlete throughout the training season as soon as they got familiar with the 1080 Sprint machine.
Coaches looking to utilize heavy resisted accelerations in their programming can safeguard against negative kinematic transference by managing the frequency of exposure and using the ALTIS Kinogram Method to monitor mechanics.
")