In the first installment of this series ALTIS Strength & Power Coach – Jason Hettler provided a brief overview of the state of heavy resisted sprint training, the ‘Living Lab’ concept, and the difference between exploratory and explanatory data collection and analysis.
The Set-Up
In this article we will feature the first 3 training cycles (9 weeks) of the 2017-2018 track season. This time-frame spanned from October 9th – December 10th, 2017 and within this period we will dive into the results from 3 male sprinters, who completed 7 resisted acceleration sessions with the 1080 Sprint. This group was chosen due to their consistency in training throughout the first 3 mesocycles.

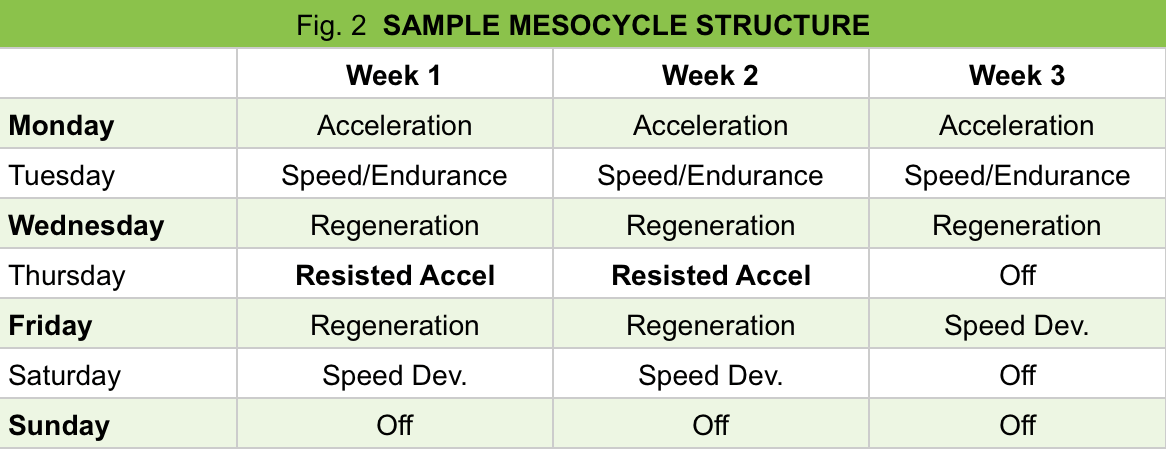
Regarding resisted acceleration sessions with the 1080 Sprint, each of these athletes shared the start and end dates of October 12th and December 7th and completed no more than one 1080 Sprint session per week (7 sessions with 2 ‘rest’ weeks). All of the resisted sprint sessions occurred on Thursdays and were conducted as part of a similar weekly structure seen below.

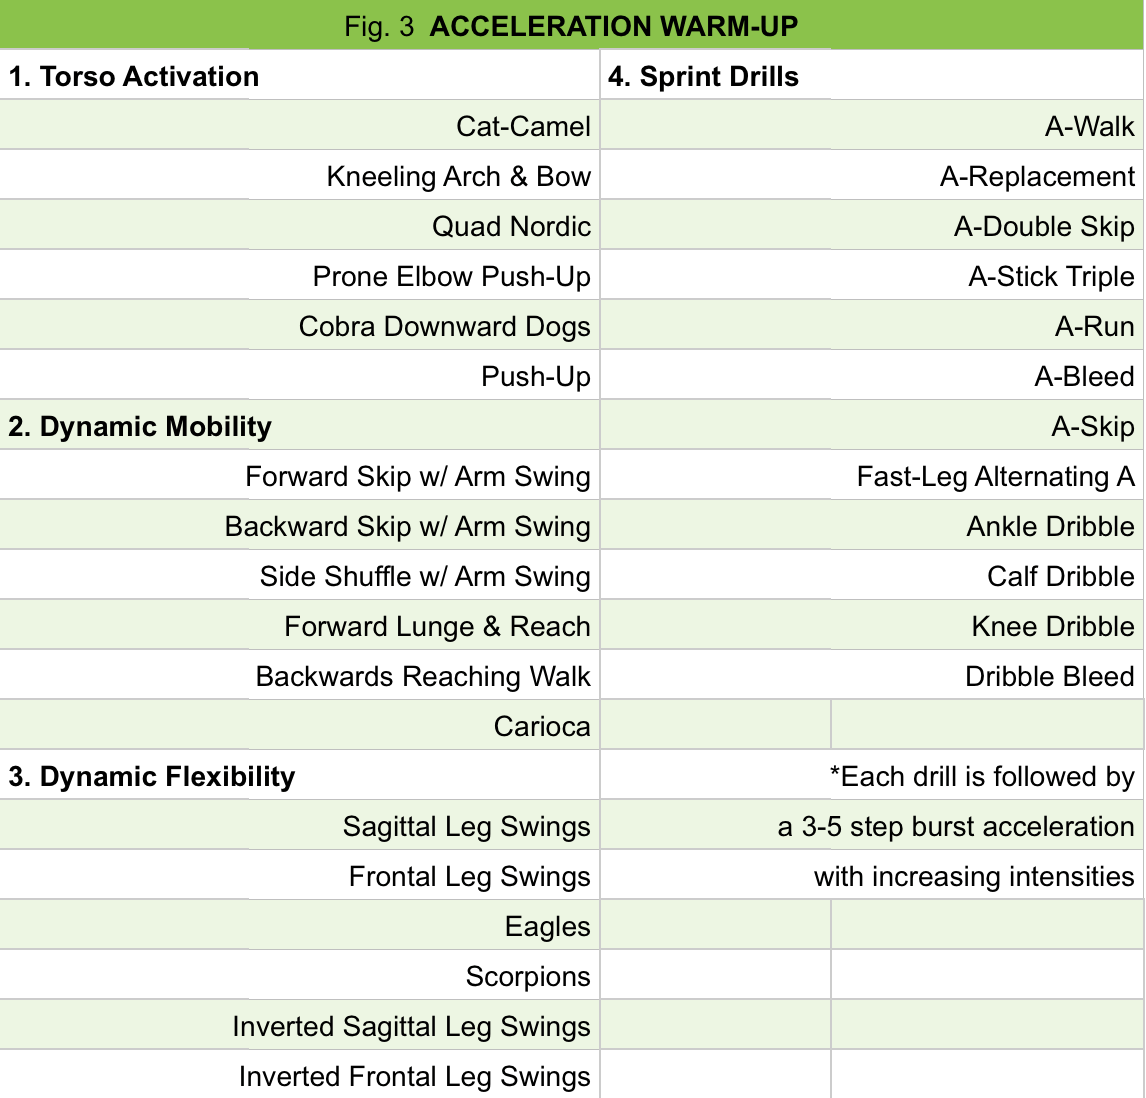
At ALTIS we employ two warm-up protocols – one for acceleration themed days, and one for maximum velocity themed days. The acceleration warm-up protocol was used prior to each 1080 Sprint session and can be seen in Fig. 3.

Load-Velocity Profiles
It is important to define two terms leading into this section…
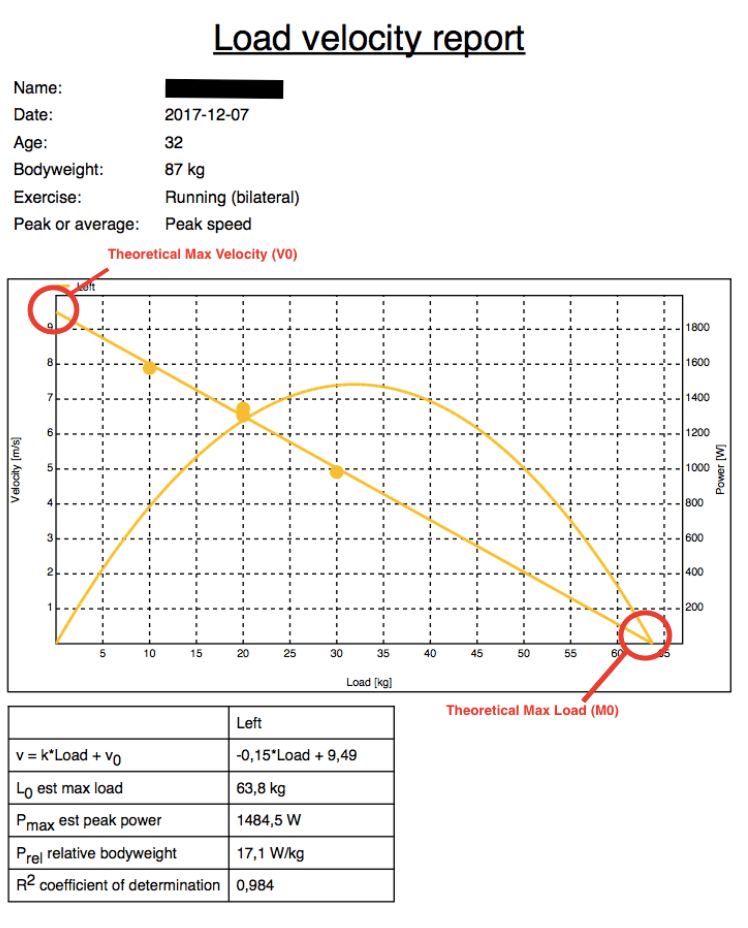
Theoretical max load (x-intercept), expressed as M0 is the corresponding load at a velocity of 0 m/s, in other words, this is the load that the athlete would not be able to produce any movement with.
Theoretical max velocity (y-intercept) expressed as V0 is the corresponding velocity if resistance to movement were zero, which places this point slightly above the actual achievable maximum velocity.
One of the beneficial aspects of the data collection via the 1080 Sprint is the creation of Load-Velocities Profiles (LVPs) from each session (Fig. 4). This profile has then been used to determine an optimal load for the generation of maximal power. The recommendations coming from Cross et al. (2016) are that maximal power output is achieved at 48-52% of theoretical maximal velocity (V0) and that sled loads of 70-96% BW are required for this to occur in sprint populations (with the range being shifted slightly lower for team sport athletes). While we have not implemented the methodology directly targeting maximal power at ALTIS, it is something we are keeping a close eye on.
The LVPs constructed from the 1080 Sprint have been our preferred longitudinal tracking metric thus far. Namely, following the theoretical max load and velocity over time has given us some insight into what is occurring and has been a much simpler approach as we continue to get comfortable with the data collection and analysis.

The Results
Within this group of 3 we saw an average increase in M0 of 6.9% with a range in increase from 4.1-8.7%. Additionally, an average decrease in V0 of -1.1% was witnessed ranging from -4.5-1.0% per individual.

As you can see in the individual results above, two of the three athletes experienced increases in both M0 and V0 (Athlete 2 and 3) while one athlete (Athlete 1) saw an increase in M0 with a decrease in V0.
Although increasing both remains the preferred adaptation, it does not come as a surprise that an individual would see an increase in M0 through this phase of the season without an accompanying increase in V0. Early season training is directed at more general capacities, namely various strength abilities, relative to later in the season. As we near the competition phase, the need to increase velocity will be much more important.
Highlighted by Samozino et al (2012), a lower slope is representative of higher force capabilities relative to velocity. Expanding on the average increase in theoretical max load of 6.9%, a lower slope and steeper relationship is seen for each of the 3 athletes within their LVPs from each session.

Limitations
A few major limitations from this period of training come to mind. To begin, variability in intent/effort as well as technical proficiency were visibly present, particularly through the first couple of sessions with the 1080 Sprint as the athlete group increased their level of comfort.
Additionally, the loading parameters were not individualized based off bodyweight or any other metric. Additionally, these 3 athletes did not always complete the same resisted acceleration session as each other. The loading schemes were designed with ease of implementation/integration in mind and it therefore becomes difficult to compare across individuals.
Moving Forward
Following the first 3 training cycles we began loading relative to each athletes bodyweight. Additionally, we began incorporating one repetition at a load of 1kg to begin each session. This is the lowest possible setting to record data with and the athlete group reports no awareness of resistance. This affords us a consistent metric to track over time as we continue to play with various loading schemes.
Stay tuned for Part III where we dive further into the training year!
References
Cross, M.R., Brughelli, M., Samozino, P., Brown, S.R., Morin, J.B. (2016). Optimal Loading for Maximizing Power during Sled-Resisted Sprinting. Int J Sports Phys & Perf. 1-25.
Samozino, P. Rejc, E. Di Prampero, P. Belli, A. Morin, J.B. (2012). Optimal Force-Velocity
Profile in Ballistic Movements–Altius: Citius or Fortius? Medicine & Science in Sports &
Exercise. 44(2), 313-22.

