OVERVIEW
VueMotion (VM) has created a software to analyse motion kinematics of a runner. The VM software is built using computer vision, machine learning, and web technologies. The system comprises a tripod-mounted iPhone camera system (or other phones with capability of 4K, 60 frames per sec recording) recording a track of 20m. The recorded video is processed using our proprietary patent-pending AI-powered software to generate motion kinematics which includes:
-
Stride Length (left, right and average in meters)
-
Stride Frequency (left, right and average in meters)
-
Ground Contact Time (in secs)
-
Flight Time (secs)
-
10 & 20m speed and time (m/s, secs)
-
Instantaneous speed and acceleration (m/s, m/s2)
-
7 step kinogram analysis (for Acc20)
-
5 phase Left/Right Kinogram analysis (for Fly20)
Fig: Camera Setup for Fly20/ACC20 Recording
In a Fly20 analysis, an athlete covers a 20-meter distance in a "fly" mode, meaning they commence running before reaching the 20-meter mark, which is the focus of analysis. Typically, a 20-meter section prior to the analysed distance is considered because athletes usually reach their peak speed at around the 20-meter mark.
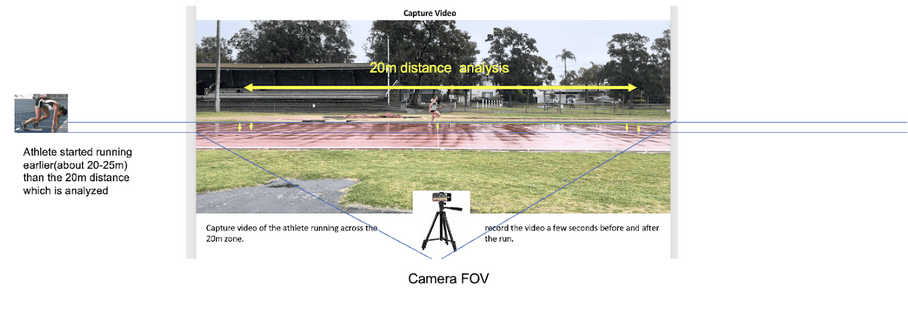
Fig: Fly20/Acc20 Setup – The runner starts running typically 20m before the track-under-observation (distance between cones)
In an Acc 20 analysis, an athlete covers a 20-meter distance in "accelerate" mode, starting their run from the initial point of the 20-meter segment under analysis. Again, a 20-meter section preceding the analysed distance is often examined due to athletes typically achieving peak speed at approximately 30 meters.
We have performed a detailed analysis of accuracy of the pipeline. The table below shows accuracy of different output metrics determined using the VM software in our validation:
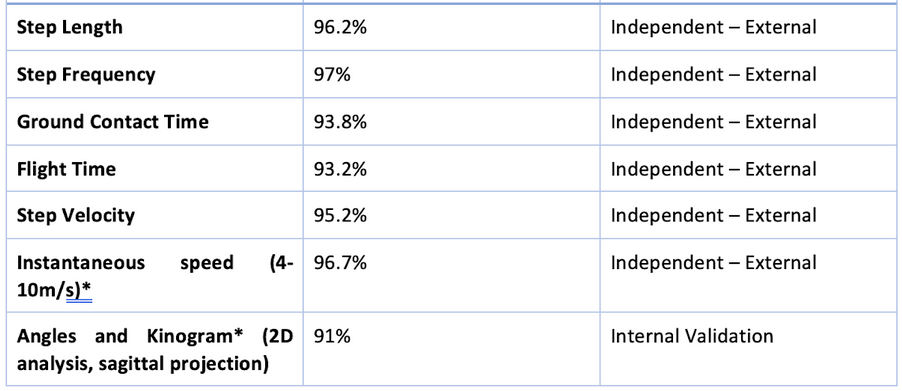
Fig: Validation Accuracy of metrics output by VueMotion
Notes:
- The independent external validation for metrics – Step Length, Step Velocity, Ground Contact Time, and Flight Time, were conducted against the gold standard Opto Jump system.
- The instantaneous speed was calculated using a fixed frame duration difference (15 frames at 60 frames per sec) and was validated with the gold standard laser system.
- The angles measured are 2D perspective angles from the camera perspective. It is to be noted that the angles represented are 2D sagittal projection of real anatomical angles and hence, the angles should be used as 2D projection representation only.
Instantaneous Speed Validation
We conducted a comprehensive validation study to compare the estimated instantaneous speed obtained from VueMotion with a criterion Laser system, which was administered independently by an external university researcher. The test scenarios included a 20-meter standing start sprint (Acc20) and a 20-meter Flying sprint (maximal velocity).
Data Processing:
The VueMotion data was recorded at 60 Hz, up-sampled using spline interpolation to reach 600 Hz, and then down-sampled it to 100 Hz. The Laser data was recorded and exported at 1000 Hz, underwent filtering with a 1 Hz low pass Butterworth filter, and was subsequently downsampled to 100 Hz to bring both data streams at same sampling frequency.
Synchronization:
The two datasets are synchronized by shifting the VueMotion data relative to the Laser data. This process involved finding the point at which the lowest root mean square difference was achieved, ensuring alignment for precise analysis.
Results:
See below:
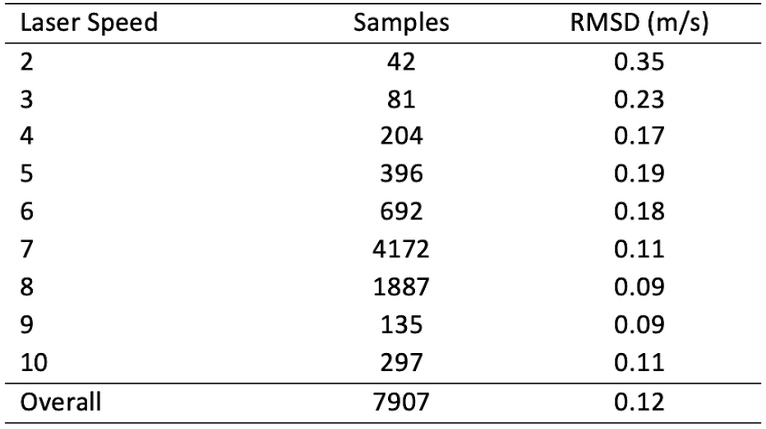
Table: Sample count and Root Mean Square Difference (m/s) between VueMotion and Laser
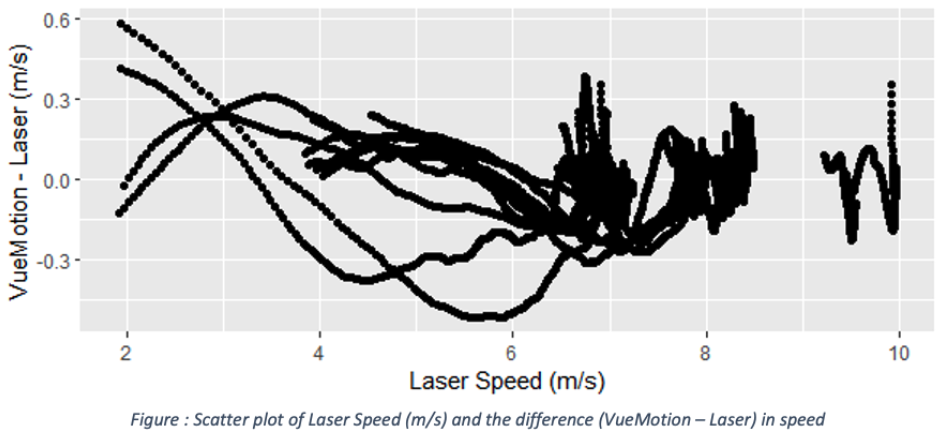
Figure: Scatter plot of Laser Speed (m/s) and the difference (VUEMOTION - Laser) IN SPEED
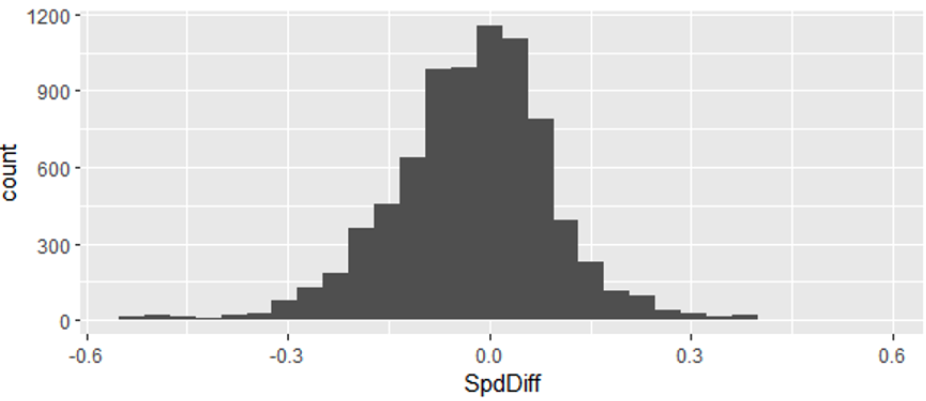
Figure: Histogram of the difference between Vuemotion and laser
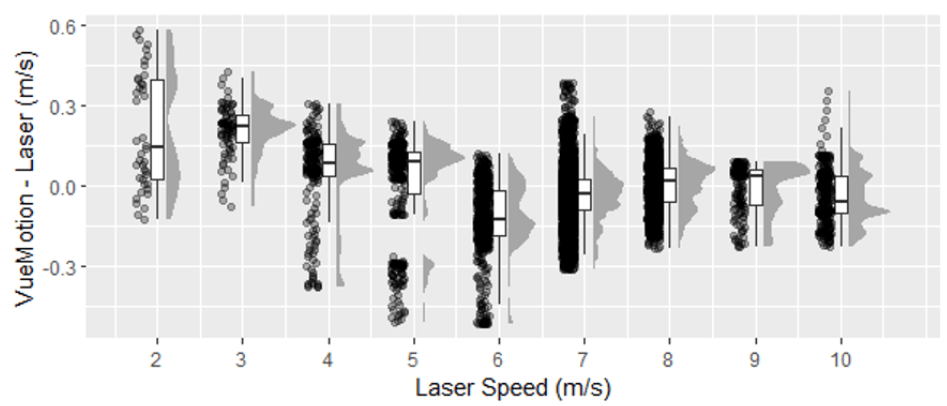
Figure: Breakdown of the difference between vuemotion and laser
In a prior investigation, it was demonstrated that the laser system offers exceptional accuracy in measuring linear sprint movement when compared to a criterion motion capture system. The precision of the laser system even surpasses that of commercially available EPTS (Electronic Performance Tracking Systems). Therefore, the laser system can serve as a valuable tool for establishing concurrent validity when assessing sprint speed using EPTS.
In our present study, we have observed that VueMotion's instantaneous speed estimation delivers a range of accuracy, with results spanning from 82.3% (for lower speeds) to an impressive 99% accuracy at higher speeds (specifically, within the 9-10m/s range). Notably, for speeds between 4m/s and 10m/s, VueMotion consistently achieves accuracy levels exceeding 95%.
Validation - Opto Jump System
The Opto Jump system is an optical measurement system consisting of a transmitting and receiving bar [http://www.optojump.com/what-is-optojump.aspx].
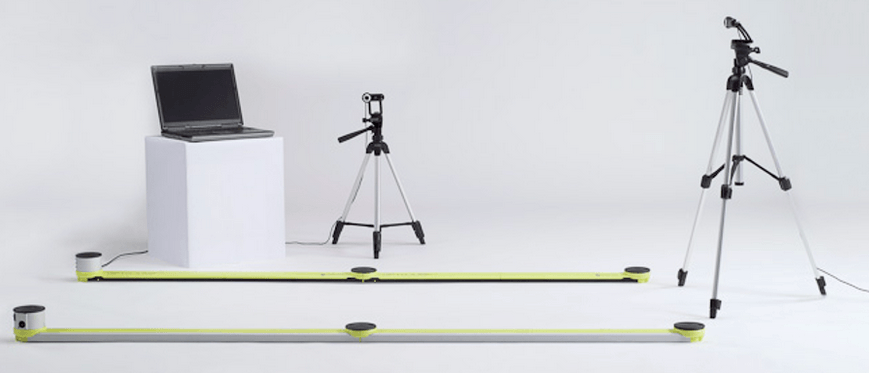
The validation is performed with our university partner – Dr Grant Duthie at Australian Catholic University using the independent blind approach, i.e., VueMotion data is shared with the ACU without VueMotion having access to the Opto Jump results.
Validation Specifications:
20 different athletes (male and females with age ranging from 18-45)
Total 80 runs recorded
Run Scenarios: Fly and Accelerate
Special Note: This experiment was conducted during late evening using artificial lights (not daylight). Videos captured in artificial light generally suffers from motion blur and hence, are not an ideal scenario for VueMotion.
The comparison results are summarized below:

The results conclude that VueMotion results are of high accuracy as follows:
- GCT: 93.8%
- Flight Time: 93.2%
- Step Frequency: 97%
- Step Length: 96.2%
- Step Velocity: 95.8%
It is to be noted that we expect even higher accuracy in natural lighting conditions and using higher frame rate capture (120/240 fps compared to 60 fps).
Indoor Validation - Vicon System
VueMotion participated with indoor validation (track length 5m) of VueMotion’s pose analysis with a multi-camera marker-based Vicon System The purpose of this investigation was to quantify the validity of VueMotion for tracking specific body landmarks during a multi-hop assessment.
Data Collection and Analysis:
During a hop movement analysis, VueMotion tracked landmarks in 2D frames captured using an iPhone 12 Pro, capturing footage at a rate of 60 Hz. For this study, a single participant completed the test six times, with three repetitions performed on each leg. Simultaneously, we collected criterion VICON data to serve as the reference for our analysis.
Quantifying Agreement:
To assess the agreement between the markerless (practical) and VICON (criterion) tracking systems, cross-correlation analysis was conducted. This involved temporally and positionally aligning both datasets. Linear regression was performed on the log-transformed values. Subsequently, a typical error of the estimate, expressed as a coefficient of variation was calculated for each of the landmarks tracked in both the X and Z coordinates.
Results:
The mean typical error for the tracked landmarks in the X-axis (up-down) was 5% ± 2%, ranging from 1% to 17%, with an accuracy of 95% ± 2%. In the Y-axis (left-right), the mean typical error was 1% ± 1%, ranging from 0% to 8%, with an accuracy of 99% ± 1%. These differences between the markerless system (VueMotion) and VICON were consistent with previously reported findings in other kinematic analysis methods.
Practical Implications:
The marker-less approach using 2D camera systems, as demonstrated by VueMotion, offers a potential avenue for efficient and cost-effective in-field data collection. This technology has the capacity to be applied to the assessment of various human movements, highlighting its versatility and utility in research and practice.
[Research conducted by ACU researchers.]
